Three mechanisms are available for generating graphs, these are:
Once the graphs have been generated a variety of distance measures are available to calculate the edge lengths between the connected nodes. Once the distances have been calculated the graph can be partitioned to produce either uniform or non-uniform sized clusters.
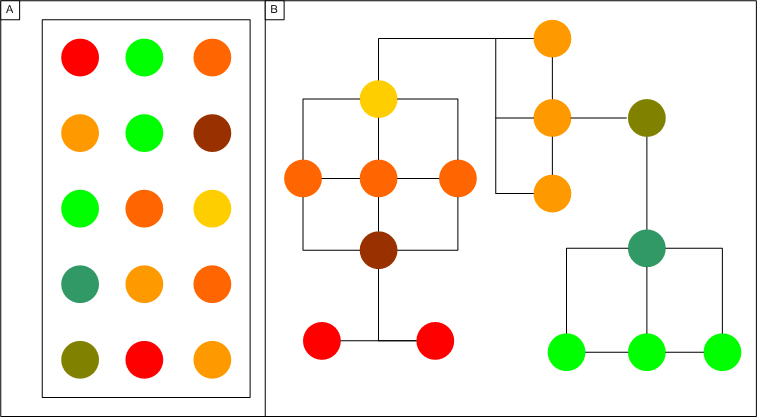
A minimal spanning tree is created based on the expression experiment results. Genes are directly connected to genes whose expression levels are most similiar to their own. As the similarity measure between two genes can be any of the similarity measures provided in SeqExpress, graphs can be constructed using information from any number of expression experiments. The distance between the nodes does not necessarily have to be the distance that was used to construct the tree (e.g. if we wished to find genes that are probably co-expression the graph could be constructed using the manhattan distance between genes, and then the distance between the connected nodes could be based on chromosome location).

Figure 1: Unconnected results of a gene expression experiment (A) can be connected by finding the mininial spanning tree (B), this is done by connecting genes to their 'nearest' counterparts.
A graph can be constructed based on the proposed location of genes on the chromosome. The chrosome location information can be imported and viewed using the genome tab. This will result in n-graphs being created, two for each chromosome (one per strand).
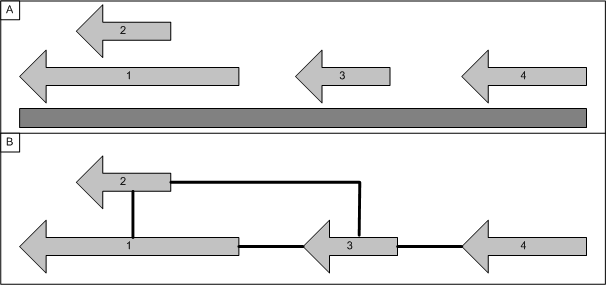
Each gene is connected to the next n-genes located downstream on the chromosome (at present genes are only connected if they are on the same strand), in the example below n is 1. Overlapping genes are treated as a group and are all connected to the next non-overlapping gene(s).

Figure 2: A graph can be constructed based solely on the location of genes on a chromosome. Genes are connected to their neighbours (or series of neighbours) to produce the graph.
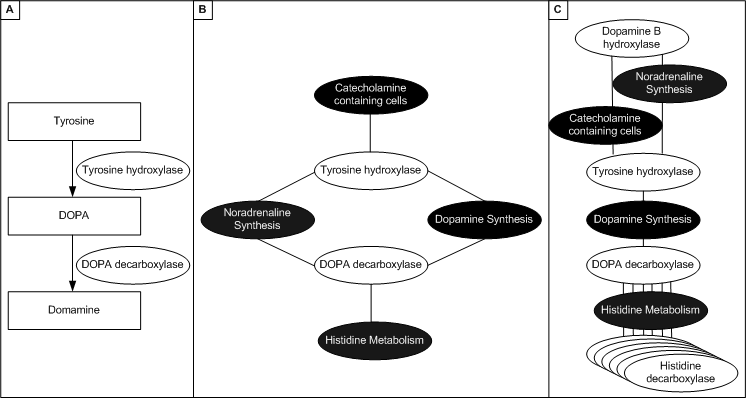
A graph of genes can be constructing by using another graph (which represents some biological knowledge) as a template. SeqExpress supports any graph that is in OBO format (e.g. Gene Ontology or similiar). A 'template' ontology is used for classifying each of the gene products related to a spot on a chip, this template ontology contains all of the viable terms that can be used for classification (i.e. the whole of the gene ontology). When analysing the data it is possible to choose one or more 'target' ontologies, these are smaller ontologies that describe specific groupings and relationships of gene products. These 'target' ontologies represent the knowledge (in terms of biological processes, cellular components, or molecular functions) of how different factors could cause the specific genes expression profiles that have been measured in the experiment. For a gene selection analysis, where we are attempting to find groups of genes that could be used to explain a particular disease state, an ontology would be used which defines groups of genes and localisations of interest. For example, for Parkinson's disease a target ontology could define groups of genes involved in acetylcholine, enkephalin and dopamine activity and production, as well as a definition of extracellular/membrane/intracellular localisation.

Figure 3: A formal representation of functional behaviour (A) (e.g. pathway information or an ontology) can be used to generate a graph, by firstly assigning function to each of the genes (B) (e.g. DOPA decarboxylase is involved in histidine metabolism and noradrenaline sysnthesis), and then the graph is created by linking genes with the same behaviour (C) (e.g. the gene for tyrosine hydroxylase is connected to DOPA decarboxylase and DOPA decarboxylase is linked to all genes involved in histidine metabolism).