Three different visualisations have been developed for the Gene Ontology and associated proteins. The visualisations are generic in nature and will work with any ontology (not just a direct graph). The visualisations are:
a TreeMap for examination of scores associated with concepts (e.g. number of assigned instances);
a Graph for the analysis of interrelationships within the ontology; and
a List View for the viewing and editing of the specific concept details.
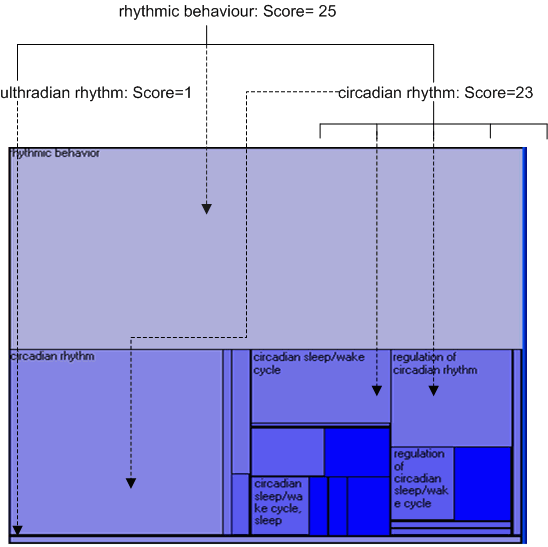
The TreeMap was developed by Ben Shneiderman, and has been used in a variety of different domains. This implementation first flattens the ontology graph (effectively turning it into a single inheritance graph), and then projects it down using the scheme shown in the diagram below. The scores which have been assigned to the different concepts (either from number of child concepts, number of associated instances or from a gene expression experiment) are mapped to the size of the different encompassing rectangles.
Double clicking on a rectangle will 'zoom into' the corresponding concept (which will also then be selected in all other open visualisations).

A 'semi' fish eyed view graph is provided to show the interrelationships between the current concept and all its children and parents. The directionality of a relationships is indicated by both the colour and direction of the interconnecting arrows. The graph details can be changed using the up and down arrows.
Clicking on a concept will navigate to the corresponding concept (which will also then be selected in all other open visualisations).

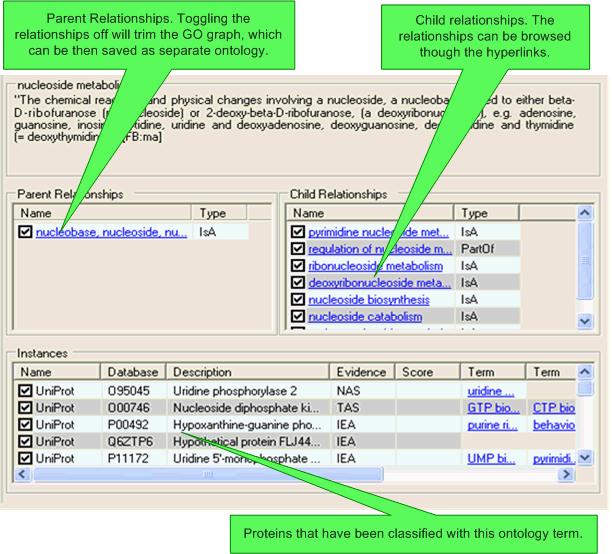
Details about the specific concept, it's child relationships, it's parent relationships (inverse relationships), and any associated protein instances are shown in the list view. It is possible to toggle relationships on/off using this view. If a relationship is toggled off then it will only be shown in the list view and the main navigation pane on the left-hand side of the SeqExplorer window, the relationship will not be used in any score calculations and will be ignored if the ontology is exported to OBO format.
Clicking on a relationship hyperlink will navigate to the related concept (which will also then be selected in all other open visualisations).

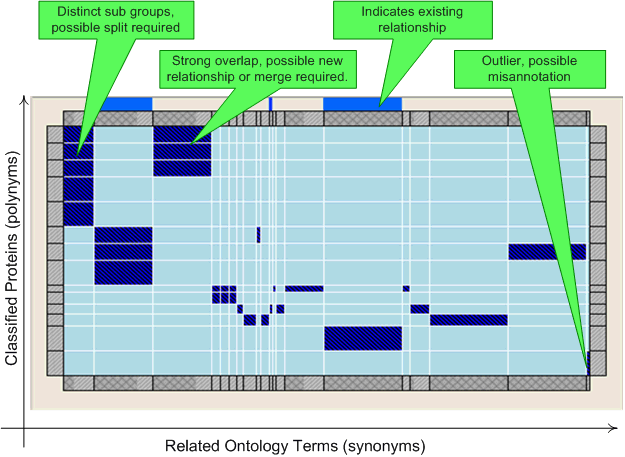
The matrix view visualises the relationships between this concept and other concepts using similarity based on the associated protein products. The matrix shows each protein product on the Y-axis, and each other concept that the protein product is also associated with on the X-axis. The size of the X-axis indicates how many proteins have been annotated using that ontology term, with the bar at the top showing the proportion of these that have additionally associated with this ontology term. The visualisation can be used to aid the identification of miss-annotations (unusually annotated proteins), where new relationships may potentially be needed (where different terms are related to the same set of proteins. This could additionally be due to concept merges being needed, although caution should obviously be used due to the multi-functional and multi-dimension nature of Gene Ontology based classification) and where a new classification should be considered (where there are recognizable sub-groups within the ontology).
Double clicking on a a protein/concept rectangle or the concept header will navigate to the corresponding concept (which will also then be selected in all other open visualisations).
