Data about a specific ontology can be imported in OBO format. In this release of SeqExplorer only OBO formatted directed graphs (such as GO) can be imported in this way. Information about associated classified instances can be read in from tab separated files.
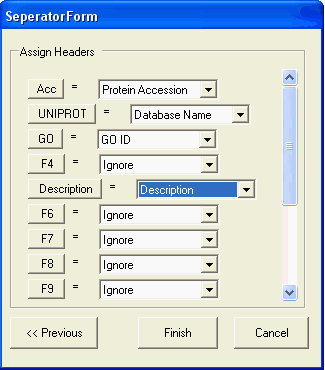
To import protein information from tab separated files select File->Import and then the file containing the information. A series of dialogs are used to guide you though the parsing process, the last dialog allows you to select the type of data contained within each column of the tab separated files:
Protein Accession column: accessions (e.g. 000155) identifying the individual protein which have been classified
GO ID: the GO Id (e.g. GO:0003677) corresponding the term used for the classification
Database Name: the name of the database from which the protein accession originates (e.g. UNIPROT)
Description: a text description of the protein
Evidence Code: the GO evidence code through which the protein instance was classified with the ontology term
Score: a numeric value which can be used to score the protein (this is optionally and doe not effect any of the inbuilt scoring methods).

Only the protein accession and GO Id columns are mandatory.
Three scoring methods are available:
Each of these scoring methods can be customised in the following ways:Relationship: counts the number of child concepts in the directed graph for each concept,
Instance: counts the number of classified instances that have been marked up with each concept,
Expression: uses the values from a gene expression experiment - this option requires a full SeqExpress installation to be present.
Relationship Scores. Configures how the scoring using the number of relationships is performed. Can choose whether or not to follow different relationships types (e.g. is_a, part_of, has_a) to calculate the number of 'child' concepts each concept has.
Instance Scores. Configures how the scoring using the number of instances is performed. Can choose whether or not to count a specific instance depending on its evidence code (e.g. IEA).
Expression Scores Configures how the scoring using data from a (set of) gene expression experiments is performed. Either the maximum value, the mean value or the minimum value of the expression profiles associated with each concept are used to calculate the score.
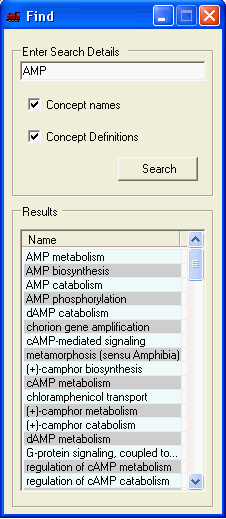
Searching through the different concepts and their definitions is supported. The results are ordered by the 'exactness' of the match. To perform a search simply enter the search term, select whether to search the concept names and/or their definition and select search. Selecting the corresponding result will navigate to that concept ain all open visualisations.
