 |
| An example set of time-course gene expression experiments, where the underlying signals are difficult to identify. |
 |
| The models describes the system as a whole, and so presents a simplified explanation of the experiment. |
The main supposition behind using models to analyse expression experiments is that the resulting set of models describes important underlying signals within the data. In this way calculated probabilities can be equated to how each of the genes is effected by such a signal. For example one model could represent a signal akin to what we would expect for the control of expression of house-keeping genes, and so all genes with a high probability for this model could be equated to house keeping activity.
|
| An example set of time-course gene expression experiments, where the underlying signals are difficult to identify. |
|
| The models describes the system as a whole, and so presents a simplified explanation of the experiment. |
The models are calculated by using Expectation Maximisation. Once the models have been calculated, it is possible to identify those genes that are best described by each of the model. By using the probability of each gene belonging to each model, genes can be clustered (where each cluster represents a set of genes that have a high likelihood of belonging to a specific model).
 |
Visual representation of the probability of each gene belonging to each of the calculated models. |
Models are most useful when they are used to compare a reference set of experiments (e.g. normal tissues) against a second set (e.g. disease tissues). By fitting sets of experiments to predefined models, and calculating the associated probabilities, genes whose behaviour has changed (the likelihood of them belonging to a model has changed significantly) can be identified.
Expectation Maximisation can be used to estimate the probabilities of genes belonging to a series of mathematical models. In SeqExpress two types of model are support:
Once the models have been discovered they can be used to analyse other experiments, visualised and used to generate clusters.
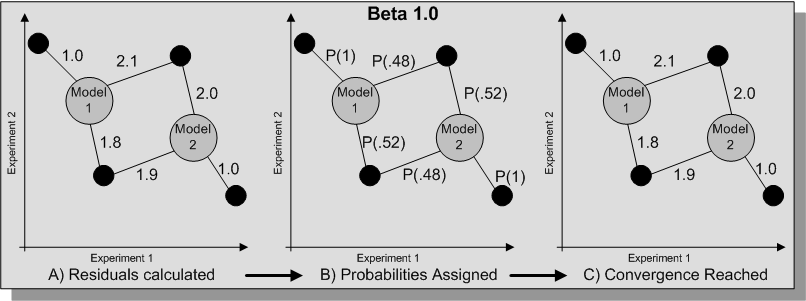
Residuals between each data points and each models are calculated and these are used to assign probabilities of each of the data points belonging to each of the models. The models are then recalculated using these probabilities and the process is repeated until convergence is reached. The implementation in SeqExpress is designed to find the most suitable model (or models) for each data point, so rather than using a cumulative log base probability score the sum of the lowest residuals is used.
To enable better fitting an energy parameter is also available which will alter the the contribution of each residual from the gene to each of the models, and thus alter the probability of a gene belonging to a specific model. If a beta value of 1 is given then no such alteration of the residuals is used, using an energy parameter effects the fitting of the model and can over come problems with local maximum (see diagram below).
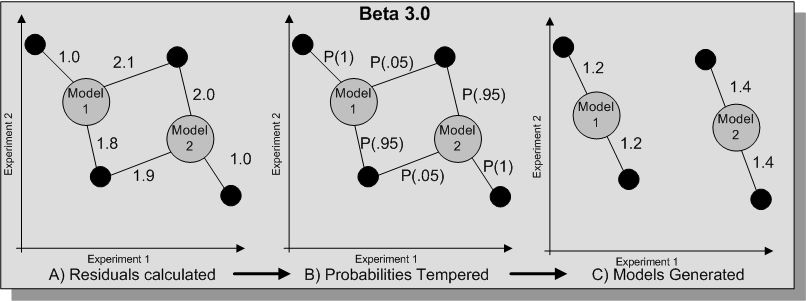
Alternatively the tempered option can be chosen, this will iterate until convergence is reach and then use these results with a different energy level until the solution fails to improve. Such model fitting involves the following procedure (where B is the energy parameter, and n is the step value):
.