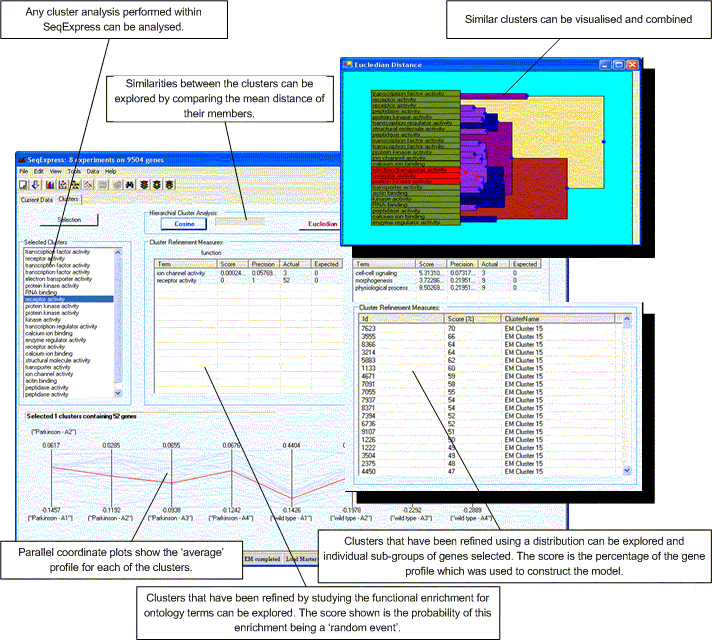
A number of visualisation are provided for the examination of gene expression information
Cluster viewers are provided to examine differences/similarities between the clusters resulting from an individual analysis/algorithm.
Cluster comparison tool is provided to compare the results of two different cluster analyses or the results of a cluster analysis against a biological relevant categorization (e.g. cell cycle, disease state, regulatory networks information)
This tool is designed for the comparison of two sets of results, for example comparing the results of a cluster analysis against some biological relevant categorized data set. The tool provides a graphical representation of the intersections between the different sets of clusters, and the (hyper geometrically defined) probability can be adjusted to show the rarer events (those which are most significant).
The example below shows the comparison of a Euclidian cluster analysis (with seeded values) against a prediction of yeast gene regulatory modules . The visualisation shows that for some regulatory modules the prediction using unsupervised techniques is surprisingly high (this is less likely to do with the predictive powers of the unsupervised technique and more likely to do with a similar geometric defined model being used to predict the gene regulatory modules).

This tools is designed to give an indication as to the biological behaviour of the clusters found by SeqExpress. Some behaviours are relatively simple to ascertain by simple geometry (for example cyclic behaviours), however most genes have a complex involvement in the governing of cellular machinery and so further analysis is needed.

The figure above shows the basic layout of the tool, it consists of a number of features:
Any selection within the cluster dendograms, parallel plots or lists within this tool are echoed in all the other views. Additionally selections in this tool are also echoed in any of the other open visualisations. If you wish to save the selected clusters as a new group of genes this can be done by selecting Edit->Copy Selected.